Phoenix Mold Season: A Month-by-Month Risk Calendar
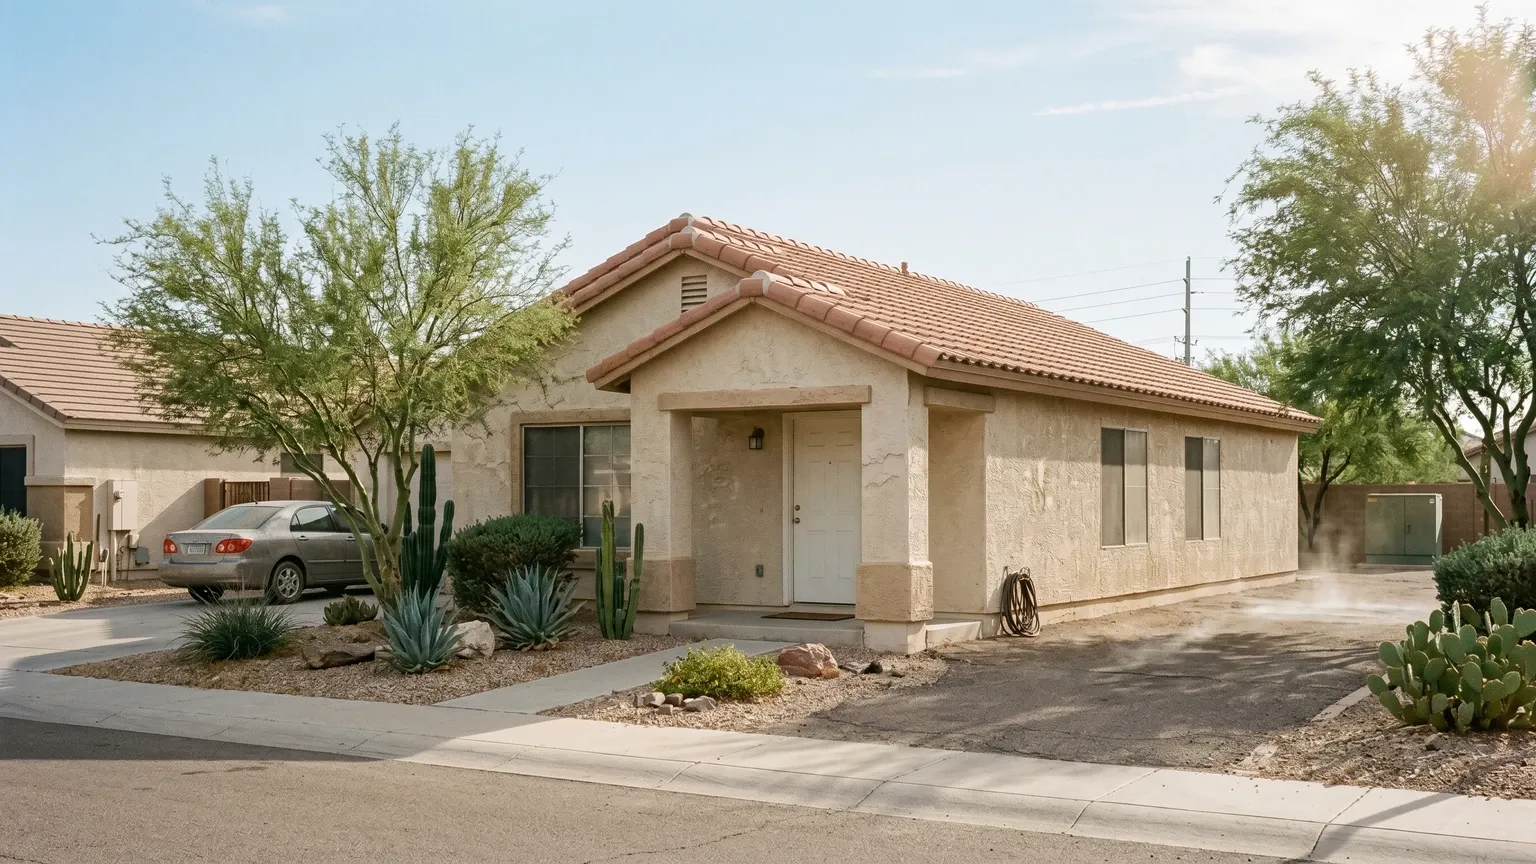
Phoenix mold risk is not spread evenly across the year. Using public NOAA/NWS climate normals and the physics of air-conditioning condensate, this guide maps each month’s risk profile — which drivers are active, how they interact, and when to act before they stack. The peak window is concentrated, predictable, and largely preventable.
Why the calendar matters: cooling degree days and condensate
Most Phoenix homeowners know the monsoon brings moisture. Fewer realize that the driver which builds across the whole cooling season — month after month from late spring through fall — is the AC system itself.
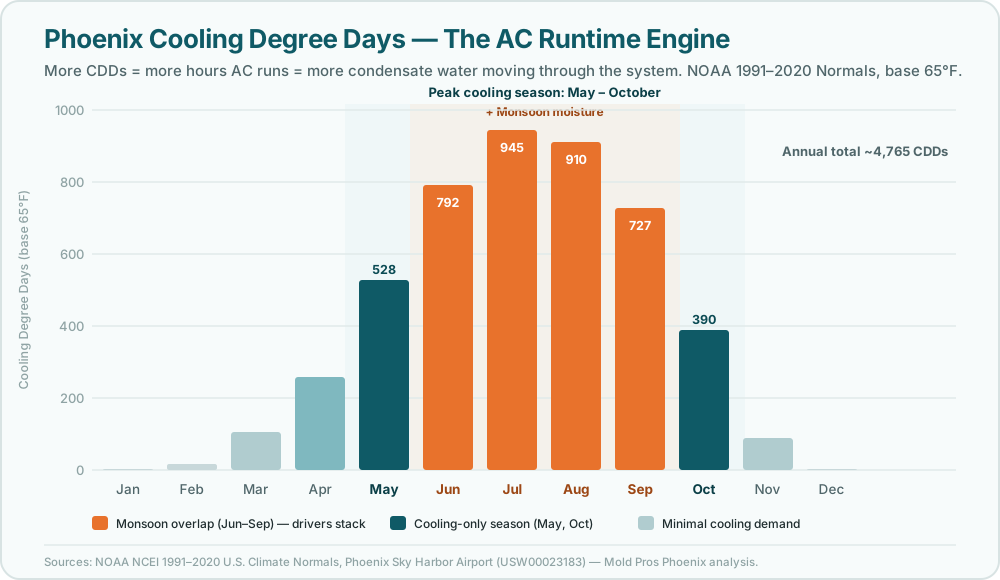
A cooling degree day (CDD) is a unit that measures how far average daily temperature exceeds 65°F — the threshold above which most buildings need mechanical cooling. Phoenix accumulates roughly 4,765 CDDs per year based on NOAA’s 1991–2020 Climate Normals for Phoenix Sky Harbor Airport, with the bulk concentrated in July (approximately 945 CDDs) and August (approximately 910 CDDs).
Every CDD represents time the AC is running, and every hour the AC runs, it condenses moisture out of the indoor air. A central air conditioner pulls warm humid air over a cold evaporator coil — moisture condenses on the coil exactly like a cold drink sweats in summer — and that water drips into a condensate drain pan, then drains through a PVC line out of the house. When that line clogs or the pan overflows, the water has to go somewhere: usually into a ceiling cavity, an attic, or down a wall.
The EPA’s A Brief Guide to Mold, Moisture and Your Home is direct: if wet or damp materials are not dried within 24 to 48 hours, mold will in most cases grow. A condensate overflow that runs for a week — out of sight in an attic — starts that clock seven times over.
How does Phoenix mold season compare to other months?
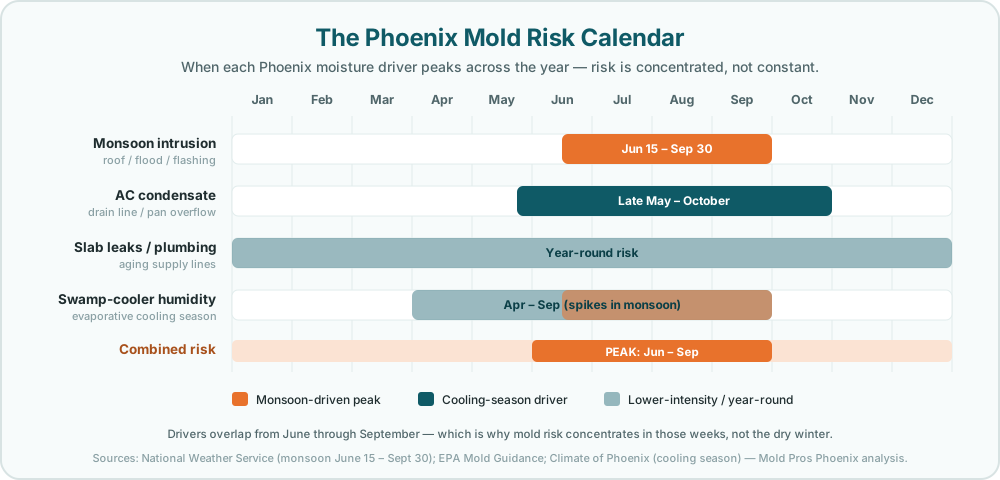
The calendar above shows four drivers plotted across twelve months. The critical pattern is the overlap: from mid-June through September, monsoon roof intrusion and peak AC condensate production run at the same time. That is the stacked-risk window.
Here is a plain-English read of each month:
January – April: Low risk. Cooling demand is minimal — Phoenix averages essentially no CDDs in January and February, with March and April still modest (roughly 105 and 259). Slab leaks and slow plumbing failures are the watch items; they have no season. Snowbird homes opening in late winter after a summer vacancy deserve a walk-through for hidden growth.
May: Risk begins climbing. Cooling demand ramps — roughly 528 CDDs in May — meaning the AC is running daily and the condensate system is active. This is the time to clear the drain line and inspect the drain pan before the system is running flat-out.
June – September: Peak risk. Monsoon season opens June 15 (NWS standardized date). Average monsoon rainfall for Phoenix is approximately 2.43 inches, roughly one-third of the annual total, concentrated into a handful of intense storms. Simultaneously, the AC is at or near its hardest annual runtime — July and August average highs sit near 106°F, the highest of the year. Both drivers are at maximum. Roof intrusion from a monsoon event plus an overflowing condensate line is the scenario that produces the largest remediation jobs.
October: Risk decreasing but not zero. The monsoon has ended, but cooling demand is still meaningful at roughly 390 CDDs. The drain line is still active, and any moisture intrusion from a late-season storm lingers as the weather cools.
November – December: Low risk. Cooling demand near zero. The primary watch is slab and plumbing leaks in vacant homes — properties closed for the winter with no one monitoring for a drip.
The AC condensate driver: inside the mechanism
Understanding why June through October is the high-risk window requires understanding what the AC system actually does with water every day it runs.
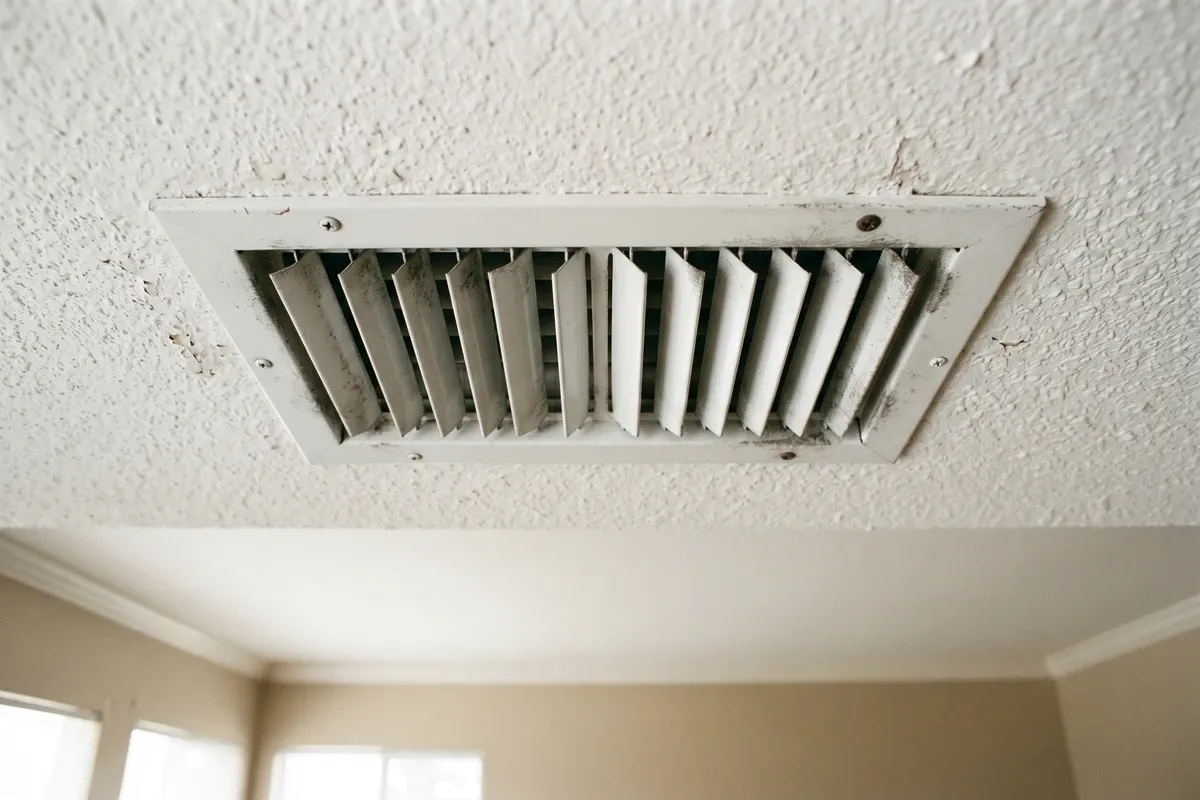
In a Phoenix home running through summer, the condensate system is handling significant water every day the equipment operates. Published building-science estimates for residential central AC condensate production range from roughly 1 to 4 gallons per day during humid conditions — with the higher end occurring when outdoor relative humidity is elevated, as it regularly is during the monsoon. These are estimates based on equipment sizing and psychrometric principles, not a measured figure from Phoenix homes specifically; actual production varies by system size, indoor set point, and outdoor humidity.
What matters operationally is not the exact gallon figure — it is that a clogged condensate drain line, over a week, accumulates enough water to saturate the ceiling material above a first-floor room or soak the insulation in an attic. And because the air handler is typically in a utility closet, a garage ceiling, or the attic itself, homeowners rarely see the failure until a water stain appears below it.
Two failure points concentrate the risk in Phoenix systems:
Condensate drain line clogging. Desert dust and algae build up inside the PVC drain line over a cooling season. A partial clog slows drainage; a full clog backs water into the pan and causes overflow. This is the most common hidden water source in Phoenix mold cases involving the ceiling or attic. Our detailed guide on mold in your AC and air vents covers the failure-point mechanics in full.
Monsoon humidity spikes. During an active monsoon, Phoenix outdoor relative humidity can climb to 50–70% during and after storms. Higher outdoor humidity means the evaporator coil is pulling more moisture from the air — more condensate per hour — which stresses a partially clogged drain line exactly when it is least able to handle the load.
The monsoon driver: fast water, flat roofs
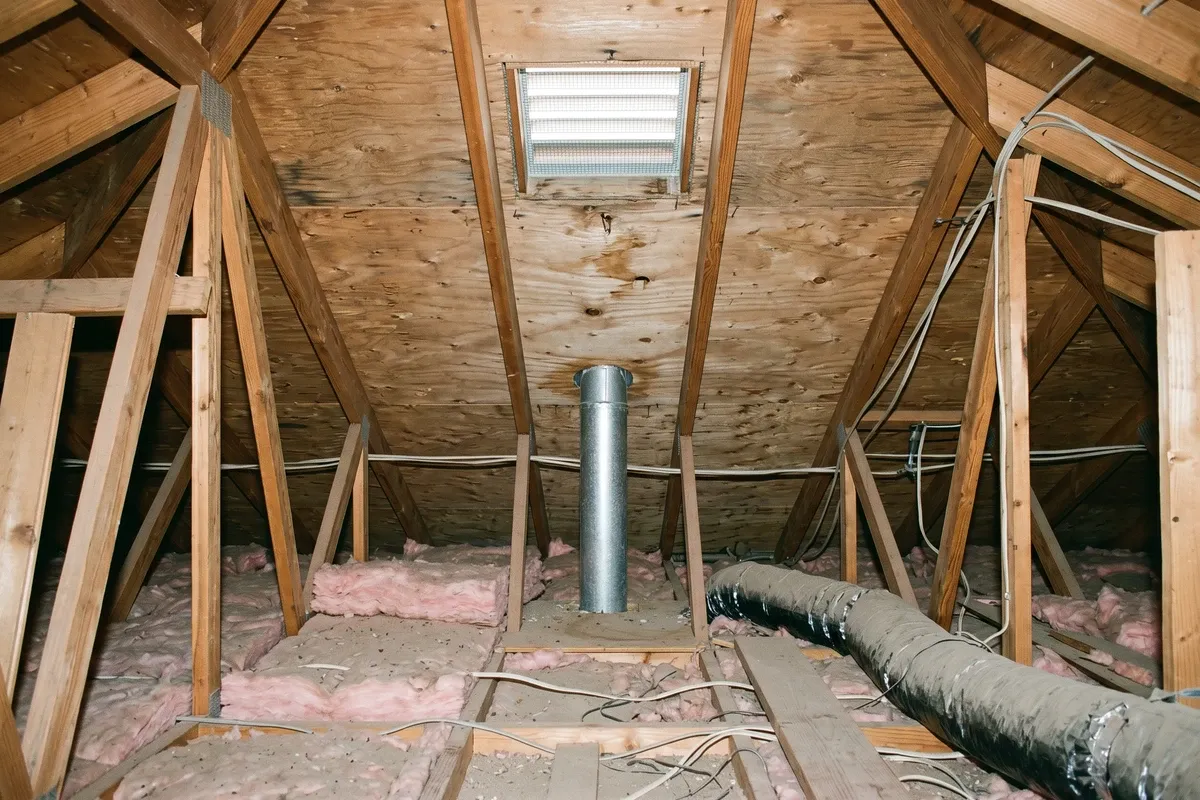
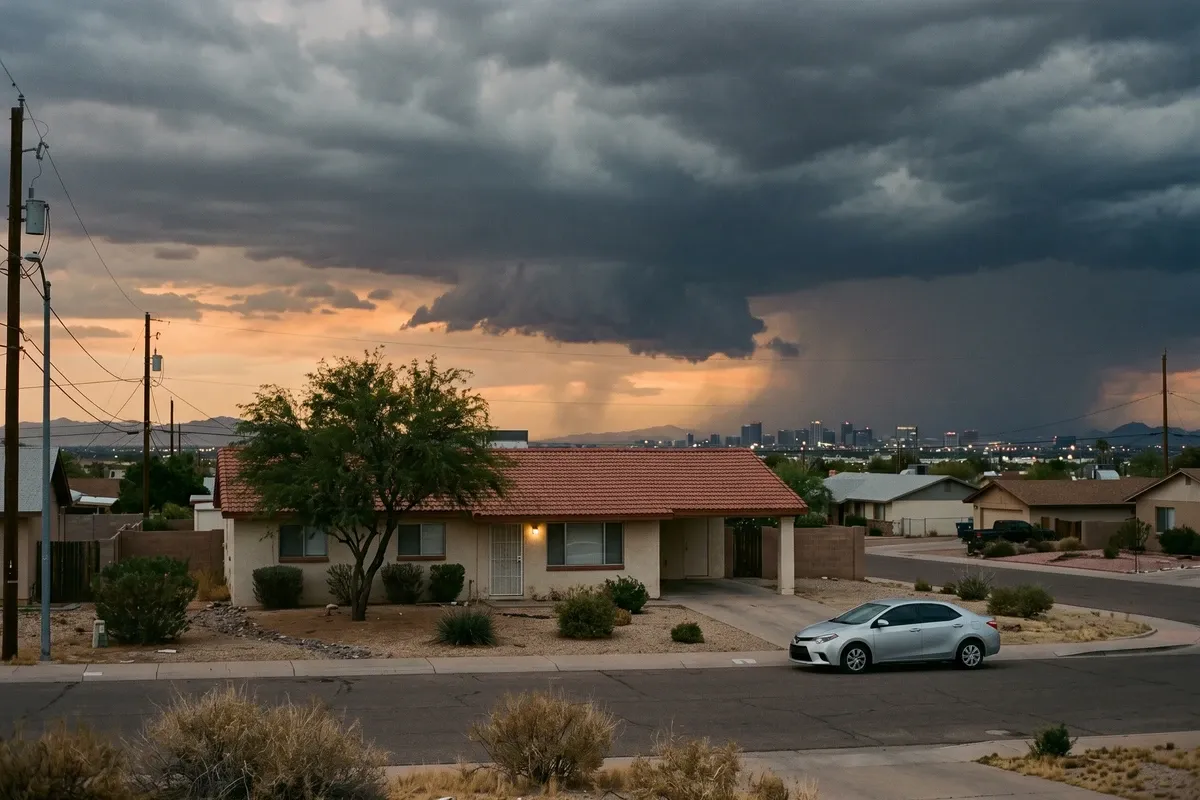
The NWS standardized the Arizona monsoon season to June 15 – September 30 in 2008. Phoenix averages approximately 2.43 inches of rain in that window — roughly one-third of annual precipitation — delivered in a handful of intense convective storms rather than steady rain.
That delivery pattern is what matters for buildings. A slow, steady rain allows roofing materials and seals to absorb water gradually. An intense monsoon thunderstorm dumps water faster than many drainage systems can clear it, and that water finds every gap: failed flashing around an AC penetration, a small crack in a low-slope parapet cap, a dried-out seal at a skylight frame.
Many Phoenix homes have flat or low-slope roofing on sections of the structure — patios, additions, covered entryways. These areas pond water under a hard storm, and any imperfection in the roofing membrane becomes an entry point. Once water enters the roof assembly, the 24-to-48-hour clock that the EPA references starts. In summer attic conditions — temperatures that can exceed 140°F during the day — wet insulation and sheathing may cycle through heat and cooling repeatedly before anyone notices the stain below.
Year-round driver: slab leaks and plumbing
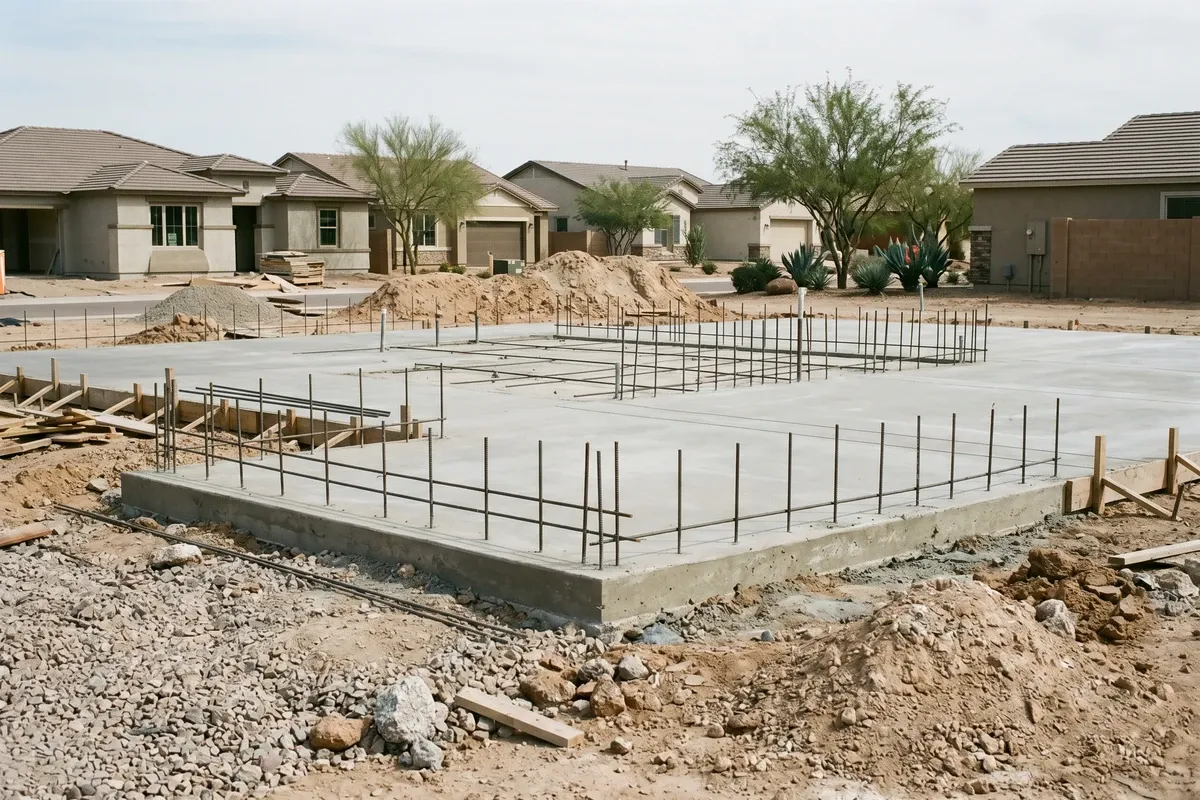
The mold risk calendar shows slab leaks and plumbing as a flat, year-round band — because they are. A pinhole leak in a copper or galvanized supply line beneath a concrete slab does not know what month it is. The failure is driven by pipe age, water chemistry, and ground movement, not the weather.
What makes slab leaks a distinct category is their concealment. There is no storm event, no visible intrusion point, and often no sound — just a slow seep that wicks upward through the concrete and into flooring, baseboards, and drywall over weeks or months. By the time the musty smell is noticeable, wet material has been sitting for long enough that mold is well established. This is the clear-cut case for a professional mold inspection with a moisture meter: the source is under the slab, and guesswork about location is expensive.
The 2026 Phoenix Mold Risk Report shows that older Valley homes — particularly pre-1980 construction with original copper or galvanized plumbing — face a higher leak rate on federal housing survey data. But slab leaks are not exclusive to old homes; they occur in 1990s and 2000s construction as well, particularly where copper lines run through alkaline caliche soil.
Secondary drivers: over-irrigation and swamp coolers
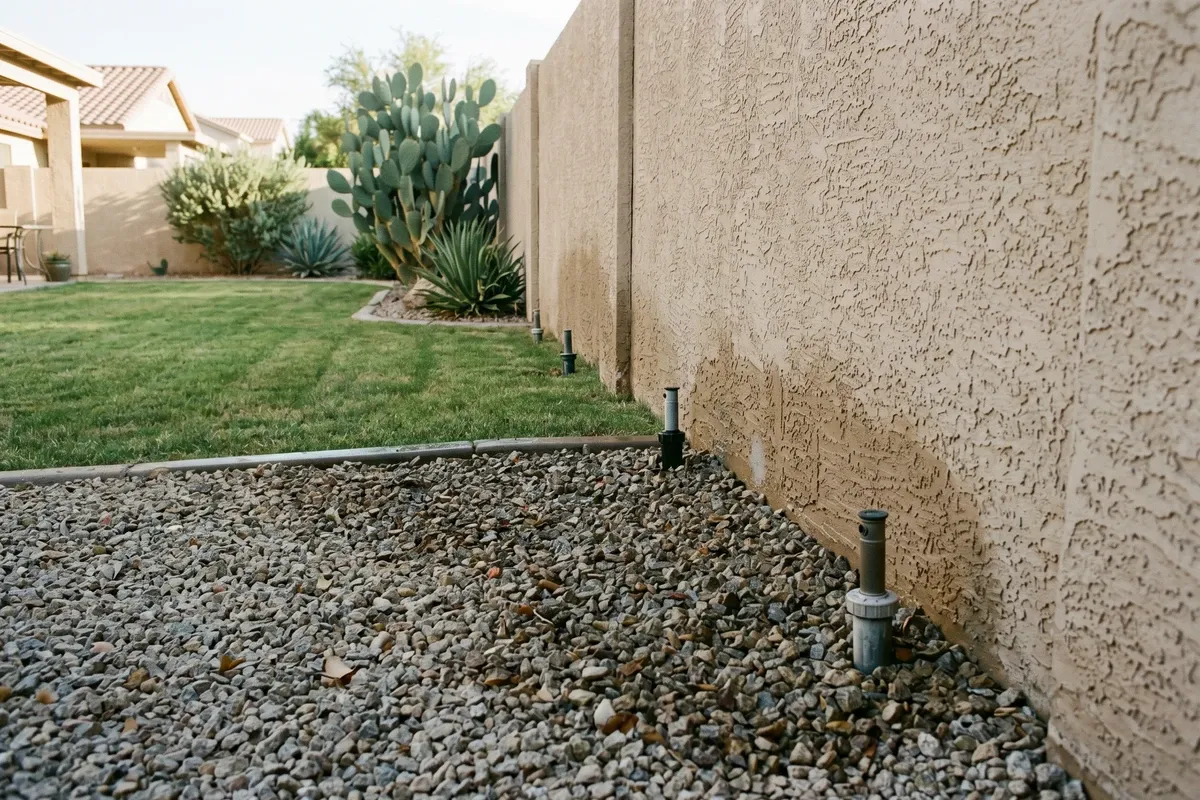
Two additional drivers appear on the calendar at lower intensity but are worth naming:
Over-irrigation and pool splash-out is a year-round, slow-acting driver. Phoenix has an unusually high pool prevalence — roughly one in four to one in three homes, depending on the neighborhood — and irrigation is routine in desert landscaping. When sprinkler heads are aimed at stucco walls or drip lines run too close to the foundation, they keep exterior masonry and soil damp. That chronic moisture can wick into the structure over time. It is less acute than a condensate overflow, but it is a driver that operates 365 days a year and compounds over the life of the home.
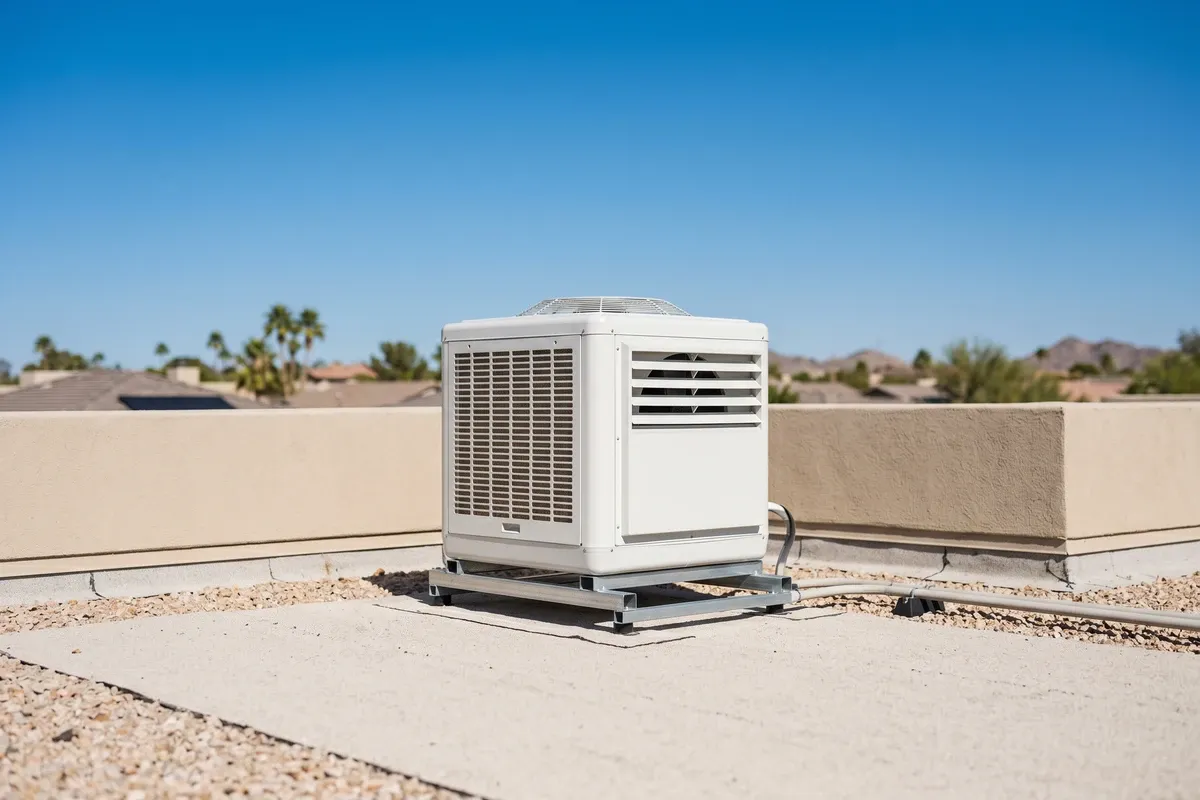
Evaporative coolers (swamp coolers) are still common on older Valley homes and outbuildings. They cool air by adding water to it, which raises indoor relative humidity by design. In dry pre-monsoon conditions that trade-off is acceptable. During the monsoon, when outdoor humidity is already elevated, a running swamp cooler can push indoor relative humidity above the 60% threshold that surfaces need to sustain mold growth. Our guide on swamp cooler mold covers the specific risk points and the seasonal logic for when to switch modes.
The spring action window: what to do before June 15
The calendar’s practical output is a to-do list timed to the pre-season window: April and May, before the June-through-September stack arrives.

April–May: pre-season maintenance window
-
Clear the AC condensate drain line. Flush it with diluted white vinegar or a commercial drain-pan treatment tablet. Check the drain pan for rust or standing water. A clogged line at the start of June, when the system is running 12+ hours a day, is the fastest path to a mold call.
-
Inspect roof and flashing. Walk the flat or low-slope sections (or have them inspected). Check the flashing around every AC penetration, plumbing vent, and skylight. Hairline cracks that stayed dry through a mild winter are exactly what monsoon rain finds first.
-
Walk the perimeter. Aim sprinkler heads away from stucco and block walls. Make sure downspout extensions discharge water at least several feet from the foundation.
-
Check the attic if you have not recently. A faint musty smell or a faint water stain on the sheathing is worth finding in May rather than September.
During the June–September peak
After any significant monsoon storm, look at every ceiling in the house. New water stains — or a stain that has grown since the last storm — need a moisture source identified before the 24-to-48-hour EPA window closes. A persistent musty smell that strengthens when the AC kicks on is the signature of a condensate or AC-system problem; our guide on what mold smells like describes the specific character of that smell and how to distinguish it from other odors.
If the source is not obvious, a professional mold inspection is the right call. Chasing a moisture source through walls and ceilings on your own costs time the EPA’s 48-hour window doesn’t give you.
How the calendar fits the broader Phoenix mold picture
This guide covers when each driver peaks across the year. The companion guides cover the what and how many in more depth:
The 2026 Phoenix Mold Risk Report maps the five specific moisture drivers — monsoon, AC condensate, pools, slab leaks, swamp coolers — and the home types most exposed to each. Read together with this calendar, they give both the timing and the mechanism.
The Phoenix Mold Statistics guide provides the federal housing survey data on how common mold actually is in Phoenix-metro homes by room type and home age.
For the myth that underlies all of this — the belief that the desert protects Phoenix homes from mold — the guide Mold in the Desert addresses it directly using the same EPA and NWS data.
The full library of Phoenix mold guides covers individual growth types, rooms, and situations in depth.
Sources
Every claim in this guide is drawn from a public source, stated explicitly. The condensate-gallon estimate is a reasoned range based on building science, not a measured figure.
- National Weather Service — Arizona monsoon defined as June 15 – September 30 (standardized 2008); Phoenix averages approximately 2.43 inches of monsoon-season rain, roughly one-third of annual precipitation. What the monsoon is and is not (12News / NWS)
- NOAA NCEI — 1991–2020 U.S. Climate Normals, Phoenix Sky Harbor Airport (USW00023183) — Source for monthly and annual cooling degree day figures (base 65°F), including the approximately 4,765 annual CDD total and the July (~945) and August (~910) monthly peaks. NOAA Climate Normals
- Climate of Phoenix (Wikipedia, citing NOAA) — July and August average highs near 106°F; cooling season among the longest and most intense in the US. Climate of Phoenix
- U.S. EPA — A Brief Guide to Mold, Moisture and Your Home — Mold grows on materials not dried within 24 to 48 hours; “the key to mold control is moisture control.” EPA Brief Guide to Mold, Moisture and Your Home
- U.S. CDC — Mold and Your Health — Mold exposure can cause nasal stuffiness, throat irritation, coughing or wheezing, and eye irritation; elevated risk for people with asthma, allergies, or compromised immune systems. CDC Mold and Health
- Building Science Corporation / psychrometric and equipment-sizing methodology — Condensate production rate estimates (1–4 gallons per day for residential central AC under humid conditions) derived from psychrometric principles and equipment sizing; a reasoned engineering range, not a measured Phoenix-specific figure. Building Science Corporation resources